

HP-search sensitivity#
How much does each flavor’s tuned result depend on the Optuna trial budget? The
base-result bake-off showed the per-flavor verdicts
are budget-dependent — alternate went from 0/5 to 2/5 datasets between a
25–50-trial budget and the paper’s per-dataset counts, and tiny auto
meta-overfits the CV objective at 200 trials. This page reconstructs, per
(dataset, flavor), how the tuned result evolves with trial count, directly
from the committed Optuna storage (benchmarks/results/alternate-base/studies/)
— no re-run of the search.
Two curves per study (design in
docs/superpowers/specs/2026-07-15-hp-search-sensitivity-curves-design.md):
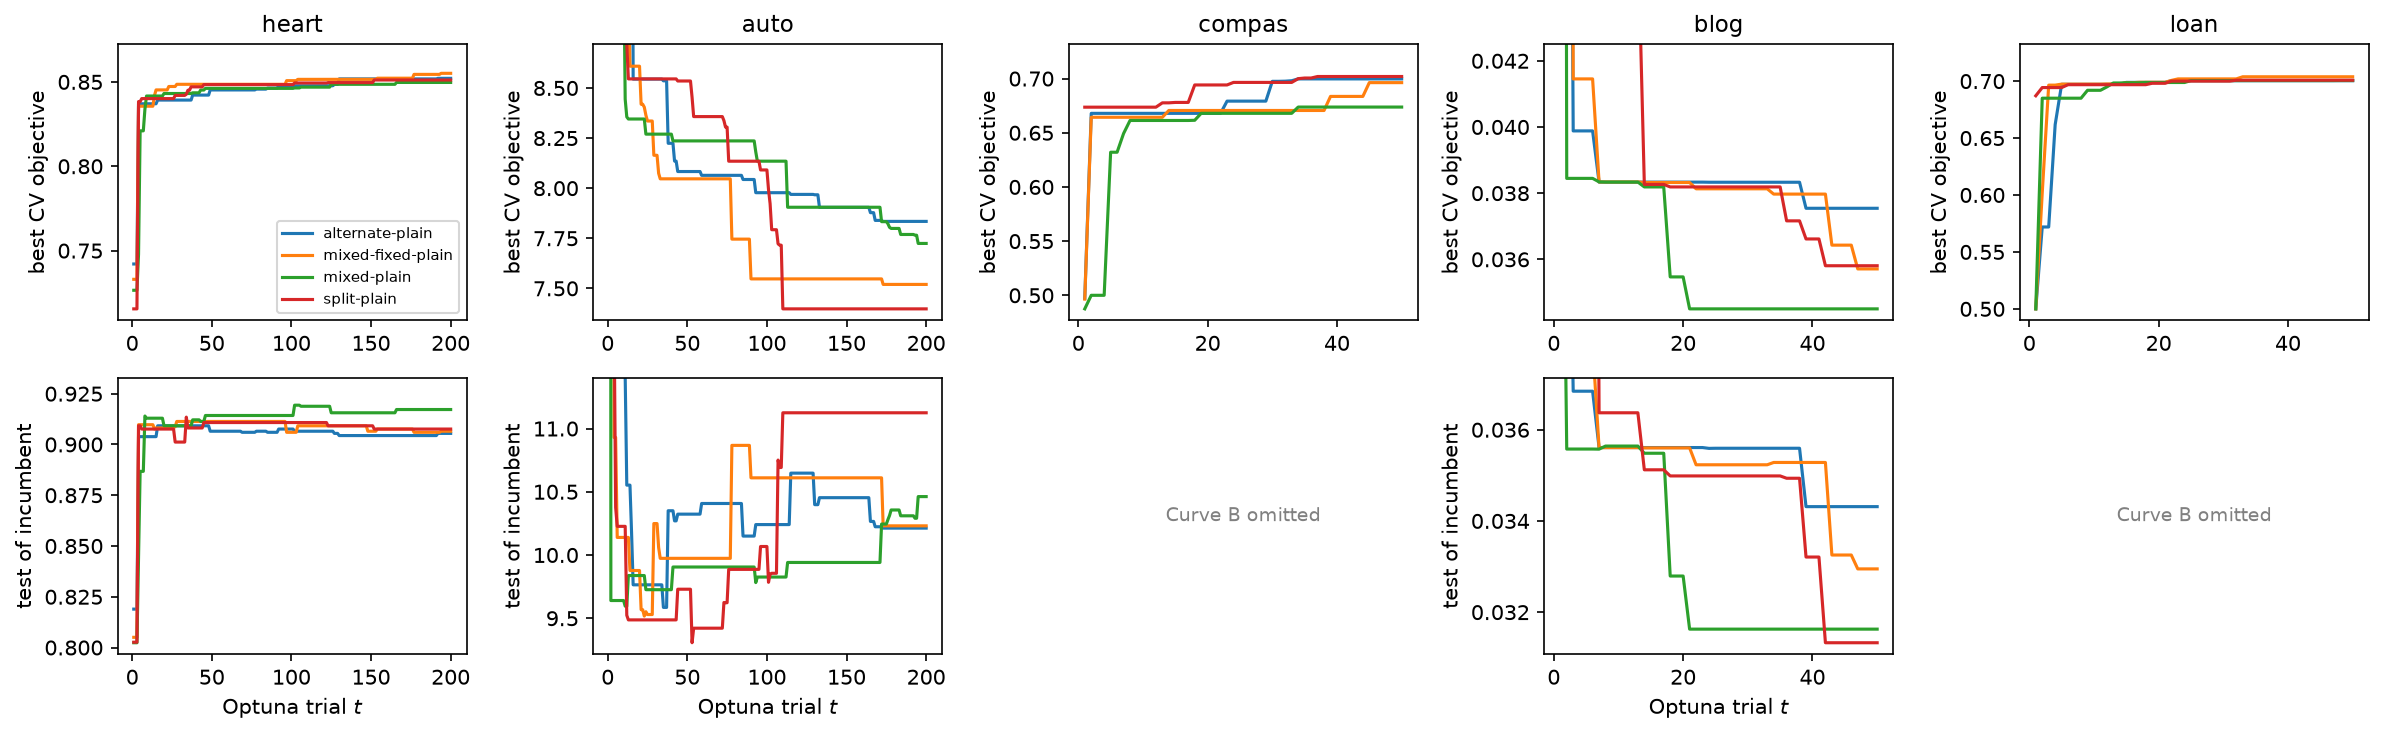
Curve A — best-so-far CV objective vs trial (top row). The search’s convergence for a single TPE run (sampler seed 0), read straight from each trial’s stored objective value. Monotone by construction. (The bad first-trial value is clipped off the top of each panel so the converged detail is visible.)
Curve B — test metric of the running incumbent vs trial (bottom row). At each trial, the held-out test metric of the best-objective config so far. Not monotone: when it turns away from Curve A — CV still improving while test degrades — the search is meta-overfitting. Reconstructed by re-evaluating only the best-so-far changepoints (a handful per study), a 5-seed IQM trend estimate. Curve B is shown for
heart/auto/blog; it is omitted forcompas/loan(# re-eval = 0below) — the re-eval is serial and compute-heavy today (loanespecially, at 419k rows), and a parallel + resumable re-eval (see Follow-ups) will fill them in cheaply.blogvalues are MSE (the search metric), not the RMSE headline.
On the lines (why no shaded band)#
Each curve is a single solid line, not a mean with a shaded variance band, and this is deliberate:
Curve A is one TPE trajectory (seed 0). A run-to-run band would need
Kindependent sampler-seed searches — TPE is adaptive (trialt’s config is chosen from the results of trials1…t-1), so its variance is a property of the whole search, not of any single trial. That is a planned follow-up ([hp-search-sensitivity-curves-design.md], follow-up 1); it costs a full re-run of every study per extra seed, so it is out of scope here.The tempting free shortcut — resampling the trial order of one run — is invalid for TPE. It would be correct only if the trials were exchangeable (random/grid search, à la Dodge et al. 2019, expected validation performance). Under TPE they are not: a good config discovered at trial 90 exists because earlier trials found it, so permuting it to
t=1reports a budget-vs-quality relationship no real short run could achieve — it makes the search look like it saturates earlier than it does, misleading the very reading this figure is for. So we do not draw a permutation band.Curve B is a 5-seed IQM point per changepoint; the per-seed spread is not currently carried through to a band.
The single lines are therefore honest point estimates, not noise-free claims; seed-variance bands are the follow-up.
Saturation#
t*(0.99) is the smallest trial count that reaches 99% of the eventual gain in
Curve A; a study is saturated (✅) when t* ≤ 0.8 × trials — it found
essentially its best config comfortably within budget. ⚠️ marks studies still
improving near the end of the budget.
dataset |
flavor |
trials |
t*(0.99) |
saturated |
# re-eval |
|---|---|---|---|---|---|
heart |
alternate-plain |
200 |
130 |
✅ |
13 |
heart |
mixed-fixed-plain |
200 |
177 |
⚠️ |
12 |
heart |
mixed-plain |
200 |
125 |
✅ |
13 |
heart |
split-plain |
200 |
152 |
✅ |
11 |
auto |
alternate-plain |
200 |
12 |
✅ |
19 |
auto |
mixed-fixed-plain |
200 |
78 |
✅ |
14 |
auto |
mixed-plain |
200 |
11 |
✅ |
17 |
auto |
split-plain |
200 |
4 |
✅ |
20 |
compas |
alternate-plain |
50 |
33 |
✅ |
0 |
compas |
mixed-fixed-plain |
50 |
45 |
⚠️ |
0 |
compas |
mixed-plain |
50 |
34 |
✅ |
0 |
compas |
split-plain |
50 |
37 |
✅ |
0 |
blog |
alternate-plain |
50 |
39 |
✅ |
6 |
blog |
mixed-fixed-plain |
50 |
43 |
⚠️ |
8 |
blog |
mixed-plain |
50 |
18 |
✅ |
7 |
blog |
split-plain |
50 |
3 |
✅ |
8 |
loan |
alternate-plain |
50 |
15 |
✅ |
0 |
loan |
mixed-fixed-plain |
50 |
23 |
✅ |
0 |
loan |
mixed-plain |
50 |
15 |
✅ |
0 |
loan |
split-plain |
50 |
32 |
✅ |
0 |
Regenerate (parallel across GPUs via the shared launcher pool):
uv run --group bench python -m benchmarks.sensitivity run \
    --storage-dir benchmarks/results/alternate-base/studies \
    --curves-dir benchmarks/results/alternate-base/curves \
    --out docs/_static/hp-search-sensitivity \
    --devices cuda:0,cuda:1,cuda:0,cuda:1 --test-seeds 5
What it shows#
auto meta-overfits — the headline. On tiny auto (314 rows) Curve B
turns away from Curve A: the CV objective keeps improving through all 200
trials while the incumbent’s test MSE gets worse. split is the clearest —
its test bottoms out near ~9.3 around trial 40, then climbs to ~11.1 by trial
110 and stays there; mixed-fixed shows the same rise (~9.5 → ~10.9). So past
~40 trials the search buys CV gains that don’t generalize. This is exactly why
auto’s 200-trial numbers are read cautiously on the base-result page.
Big data doesn’t — the contrast. On blog (47k rows) Curve B tracks Curve
A downward: the incumbent’s test MSE keeps falling as the CV objective
improves, no divergence. Meta-overfitting is a small-data phenomenon at these
budgets.
Saturation. split finds its best config almost immediately on the larger
datasets (blog t*=3, auto t*=4) — the |W| variants and alternate
take longer to converge. heart is the outlier: every flavor keeps improving
its CV objective late (t* = 125–177 of 200, mixed-fixed never comfortably
saturating), yet Curve B is essentially flat — the late CV gains on this small,
noisy dataset are not real generalization. Where a study is ⚠️ and its Curve B
is flat or rising, the extra budget is not buying test performance.
Takeaway. The paper’s larger budgets (200 for heart/auto) are past the
point of useful CV convergence on the small datasets and, on auto, actively
into meta-overfitting territory — a lighter budget would give a more honest test
estimate there. The prospective log_test_trajectory flag on
benchmarks._common.search.search records the test metric per trial during the
search, so future studies get Curve B for free (no incumbent re-eval).
Follow-ups#
Sampler-seed band on Curve A. The lines are single TPE trajectories (one seed); a genuine run-to-run band needs
Kindependent sampler-seed searches per(dataset, flavor)— a full re-run each. (The tempting free shortcut of resampling one run’s trial order is invalid for TPE — its trials aren’t exchangeable, so a permutation band would understate the budget needed.)Parallel + resumable re-eval. The Curve-B re-eval is serial and launch-bound today (one process, one core, GPUs mostly idle), and writes only at the end (no resume). Fanning the independent incumbent re-evals across the device pool and memoizing
trial → test IQMwould make it ~10–20× faster and restartable — thencompas/loanCurve B fill in cheaply. A per-incumbent progress log is already inextract.Adopt
log_test_trajectoryfor dedicated sensitivity runs so Curve B is free from storage (no re-eval at all).